liplot
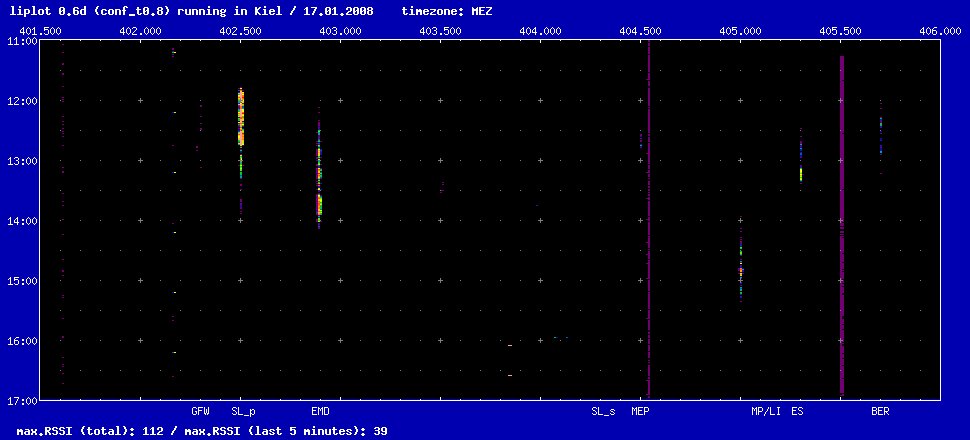
To learn more about the current wind directions and launchtimes of nearby stations it is necessary to overview the spectrum. A self-written perl software does that job under Linux and controls an Icom PCR-100 receiver. The spectrum map can be uploaded to a website (f.e. in intervals of 5 minutes). The spectrum above shows a rather normal launch-day.
The latest version also records short WAVE-files of the loudest signals. So it is possible to determine the model of the used radio sondes without the need of listening in real-time.
back to the homepage